Experiment Canvas
The experiment canvas helps you design the right experiment at the right time. With this canvas, it is easy to design a well-defined experiment.
Use this tool when:
- you want to define an experiment to validate your assumptions
Overview
| Time | ± 45 minutes | |
| Difficulty | 3 / 5 | |
| People | 3 - 5 | |
| Author | ash maurya | |
| Website | ||
| License | CC BY SA 4.0 |
What is it and when should I use it?
The purpose of the experiment canvas is to design the right experiment at the right time, facilitating a team to have the right conversation. With the experiment canvas, it is easy to design a well-defined experiment.
Track the data immediately and write everything down, so that you can check afterward if you interpreted the results correctly.
Tool Overview
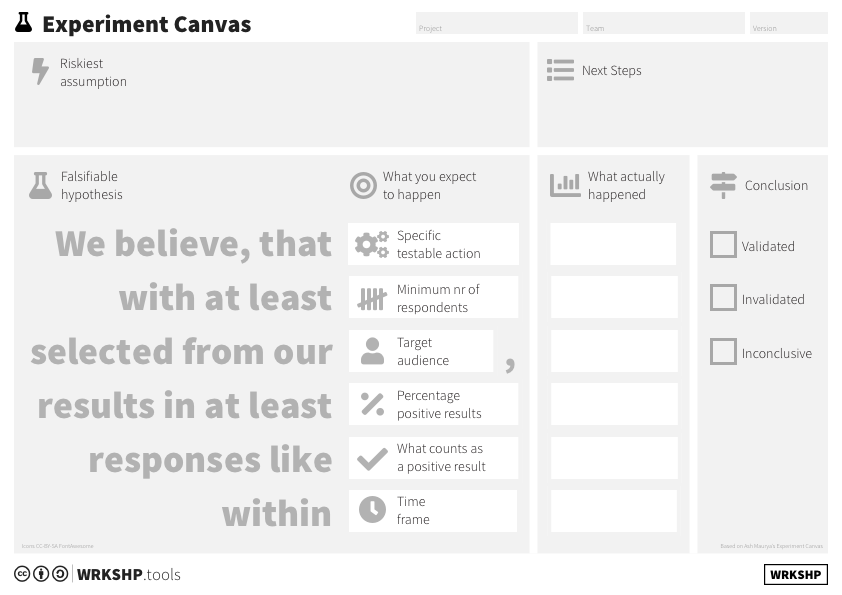
Riskiest assumption The assumption you want to validate
Falsifiable hypothesis A statement defining your hypothesis, the way you will know your assumption is valid or invalid.
What actually happened The results for each of the items in the hypothesis.
Conclusion The outcome of the experiment.
Next steps The next steps you take (pivot or persevere).
Steps
1 Select your Riskiest Assumption
Start with identifying the current Riskiest Assumption and describing it in a way that you want to test. What will it mean for your idea if this fails? How can you tell?
2 Define your Hypothesis
Specify a clear, falsifiable hypothesis and experiment setup. After running the experiment, check the results and plan your next steps.
Your hypothesis is a statement you believe to be true about your riskiest assumption. Write it down before you run the experiment. It is too easy to change the conditions afterward to make the data fit, and this robs you of valuable insight.
For this version of the canvas, the original hypothesis formula is extended so it is easier to make it quantifiable.
Hypothesis: 'We believe, that (specific testable action) with at least (minimum number of respondents) selected from our (target audience) results in at least (percentage) responses like (what counts as a positive result) within (time frame).'
Each of the elements in brackets need to be quantified.
It’s okay to use a bandwidth for this, as long as you specify it upfront. The metrics you define need to be actionable (i.e., they need to directly relate to the hypothesis) and accessible (i.e., you need to be able to see the results).
Try to find benchmarks to define percentages, and allow for the fact that if you have small numbers of respondents, you will need quite large measurements to be sure. Look for large percentages.
- Specific testable action: This is what you will do as your experiment. It usually ties in with the prototype and the method of your experiment. Examples are: get people to click on an online ad, run interviews, or have a user test.
- Minimum number of respondents: You will need some lower bound on this. If you fail to meet that lower bound, you won't be able to get any results from your experiment. If you have an experiment with a clear yes/no answer, go for at least 30-50 people. More is better.
- Target audience: The group of people you will select from. Also think about how you will select them. Is it random? Or do they already know you?
- Percentage positive results: The percentage above which you will define the experiment outcome as validating your assumption. When talking to people, try to go for larger percentages (>50%). If you have an online experiment, try to find a conversion benchmark, and aim for at least double.
- What defines a positive result: The type of answer or customer behaviour you count as a positive result. In the best experiments, it is a commitment the customer gives. This can be a small commitment, such as giving their email address or showing up at a meeting, or a larger one such as giving access to network, or actually buying a product or service. The stronger the commitment, the more significant the result. This aspect is linked to the protocol you define.
3 Define a Protocol
Having a good protocol to run the experiment is key to quality results. It's a complete science to do this right, but for our purposes it is sufficient to just avoid the biggest mistakes.
- Create a Google Sheet accessible to all the team members that will run the experiment.
- Create a uniform list of questions or observations. Include some questions to establish rapport with your respondent.
- Define how you will demonstrate prototypes, and ask questions. How long will the experiment take?
- Define how you will score the results. E.g. when your respondent volunteers they have a certain problem, that counts as 5 points. When they only acknowledge it when you ask about it, it's just 1 point. For a prototype, the amount of time the respondent is engaged could be part of the score, or the number of features they tried out.
- Make sure your scores are meaningful.
- Define how you select respondents
- Define how you'll tally up the score, and what score will mean the interview or demonstration counts as positive. Specify any qualitative outcomes and variables. What different answers you are expecting? How will you cluster them?
4 Build the experiment
Here, you'll need to come up with the questions or prototypes you need in detail.
The materials you'll create fall broadly in three categories: interviews, offline prototypes, and online prototypes.
You rarely need to test a technical prototype at this stage. In most cases, if it actually works in reality only becomes interesting after you have made sure people are waiting for it. So when we say 'prototype' we really mean something that looks ‘just real enough’ that customers are able to react to it in a meaningful way. And when we say 'just real enough' that is really telling you to do the bare minimum. No difficult branding exercises, technical setups, or scalable solutions!
Never forget the golden rule: KEEP IT SIMPLE!
5 Run the Experiment and Collect Data
Ok, so you have an experiment setup. Now it's time to get out there and collect the data. Use the protocol to your advantage! Make sure you record everything of value (and use for instance a google sheet to fill in the data).
6 Interpret the Data
Once all the data is in, it's time to go over it. Get your team together and score the data. For qualitative experiments, have a look at the Experiment Outcome Canvas also included.
7 Draw conclusions
Once you have your data all interpreted and scored, it's time for conclusions. Get your scores together and compare what you got with the hypothesis you setup.
- Do you have enough respondents?
- Are the respondents in the right target group?
- Are the respondents diverse enough?
- Did you get enough positive scores?
If you can answer 'yes' to all of them, then you'll have a validated assumption. If you can answer 'yes' to the first three points, but didn't get enough positive scores (the last point), you'll have invalidated the assumption. If you can't answer points 1-3 with 'yes', you'll likely have a botched experiment, and the result is inconclusive.
8 Next Steps: Pivot, redo, or persevere
Ok, you've got your conclusions. Time to act on them. There are three paths forward:
- Validated: You can persevere. Pick your next Riskiest Assumption and do an experiment to validate it.
- Invalidated: You'll likely need to pivot. Go back to the drawing board and see how you can modify your idea armed with this new knowledge about your Riskiest Assumption.
- Inconclusive: You'll need to take a hard look at your experiment. Did you perform it right? Did you have the right setup? The right hypothesis?